
Grassroots football clubs post match updates, training photos, and fixture announcements across social media platforms every week. Yet most teams struggle to understand whether anyone actually sees these posts - or more importantly, whether they drive the actions clubs need, like match confirmations, sponsorship enquiries, or new player registrations.
Football social media analytics transform guesswork into strategy. Rather than posting content blindly and hoping for the best, clubs can use data to understand what resonates with supporters, parents, and potential sponsors. For volunteer managers juggling team organisation alongside social media duties, this analytical approach saves time by focusing effort on content that genuinely works.
The challenge lies not in accessing data - most platforms provide basic metrics - but in interpreting what those numbers mean for a grassroots football club's specific goals. A post with 500 views might seem successful, but if it generates zero match confirmations from available players, it fails its primary purpose.
Why Analytics Matter for Grassroots Football Clubs
Time Constraints for Volunteer Managers
Community football teams face distinct challenges compared to professional clubs with dedicated media departments. Volunteer managers typically handle social media alongside fixture scheduling, player availability tracking, and parent communication. Time constraints mean every post must justify the effort invested.
Analytics reveal patterns that gut instinct misses. A club might assume Facebook reaches the most parents because that's where they personally spend time, whilst data shows Instagram stories generate three times more engagement from the under-35 parent demographic. Similarly, posting team news at 6 pm on Friday might feel logical, but analytics could revealthat Tuesday lunchtime achieves 60% higher reach.
Financial and Sponsorship Pressures
Beyond efficiency, football team management requires understanding which communication channels actually work. A club wasting hours crafting Twitter threads that reach 12 people could redirect that effort toward WhatsApp groups or email newsletters that connect with 90% of the squad.
Financial pressures add urgency. Grassroots clubs increasingly rely on commercial sponsorship to fund kit, pitch hire, and coaching courses. Sponsors want evidence that their investment reaches audiences. Football social media analytics provide concrete proof - demonstrating not just follower counts but genuine engagement rates, demographic reach, and conversion metrics that justify sponsorship fees.
Understanding Core Social Media Metrics
Football social media analytics encompass dozens of data points, but grassroots clubs should focus on metrics that directly impact team management and club sustainability.
Key Metrics for Grassroots Clubs
Reach measures how many unique accounts see content. For match announcements or fixture changes, reach determines whether critical information reaches the entire squad. A post with 80% reach amongst followers ensures most parents receive updates, whilst 20% reach suggests the platform algorithm suppresses content or posting times miss the audience.
Engagement rate calculates interactions (likes, comments, shares) as a percentage of reach. Whilst reach shows who saw content, engagement reveals who cared enough to interact. A sponsor showcase post with 400 views but zero engagement signals weak content, whereas a training photo with 150 views and 45 likes demonstrates genuine supporter interest.
Click-through rate matters for posts containing links - whether directing parents to football coaching apps for match confirmations, online payment portals for subscriptions, or sponsor websites as part of commercial agreements. High reach means nothing if nobody clicks through to complete required actions.
Follower growth rate tracks whether the club's online community expands over time. Stagnant follower counts suggest content fails to attract new supporters, potential players, or commercial partners. Consistent monthly growth indicates the club's digital presence strengthens its real-world community.
Story completion rate applies specifically to Instagram and Facebook Stories. This metric shows what percentage of viewers watch stories through to the end. Low completion rates mean content loses attention quickly, suggesting shorter clips or more compelling opening frames would improve performance.
Demographics data reveals who actually engages with content. Age ranges, geographic locations, and gender breakdowns help clubs understand their digital audience. An under-13s team discovering 70% of their followers are aged 35-44 confirms they're reaching parents rather than players - validating content strategies focused on fixture logistics rather than youth-oriented entertainment.
Interpreting Analytics for Team Communication
Grassroots football clubs primarily use social media for operational communication - confirming match attendance, announcing training cancellations, and sharing fixture updates. Analytics reveal whether these critical messages actually reach their intended audience.
Content Type Comparison
Compare engagement metrics across different content types. Suppose match day team sheets posted as image graphics generate 200% more saves and shares than text-based lineup announcements. In that case, the data indicates parents prefer visual formats they can screenshot and reference later. Clubs should adapt accordingly, investing time in Canva templates rather than plain text posts.
Time-of-day analysis identifies when target audiences actually scroll social feeds. Many clubs post fixture reminders at 8 pm on Friday evenings, assuming parents check their phones after their children's bedtime. Analytics might reveal engagement peaks at 12:30 pm when parents check phones during work lunch breaks, or 7 am during morning commutes. Scheduling posts for these high-activity windows dramatically improves reach without changing content quality.
Platform Effectiveness
Platform comparison prevents wasted effort. A club maintaining active presences across Facebook, Instagram, Twitter, and TikTok might discover 85% of meaningful engagement occurs on just Facebook and Instagram. Analytics justify abandoning underperforming platforms, redirecting volunteer time toward channels that genuinely connect with the squad.
Story analytics specifically help clubs understand ephemeral content performance. If fixture reminder stories achieve 90% completion rates whilst training session recaps average 30%, the data suggests parents value practical information over retrospective content. Clubs should prioritise operational updates in story formats whilst moving training highlights to permanent feed posts.
Direct Feedback Mechanisms
Poll and question sticker responses provide direct feedback. Instagram story polls asking "Can you make Saturday's match?" generate both engagement metrics and practical attendance data. High response rates indicate parents actively monitor club stories, validating this format for time-sensitive communication.
Using Analytics to Strengthen Sponsor Relationships
Commercial sponsorship increasingly sustains grassroots football, funding everything from kit to pitch hire. Sponsors expect visibility, and football social media analytics provide measurable proof of exposure value.
Quantifying Sponsor Value
Impression data quantifies sponsor logo visibility. When a club posts match photos featuring sponsor branding across team shirts, analytics show exactly how many accounts viewed that content. A post generating 2,400 impressions demonstrates tangible advertising value - evidence that justifies renewal conversations and potentially increased sponsorship fees.
Engagement metrics prove audience quality. A sponsor showcase post with 300 likes and 45 comments demonstrates active supporter interest, not passive scrolling. Comments specifically mentioning or praising sponsors provide qualitative evidence of positive brand association - valuable testimonial content for sponsor reports.
Click-through rates matter most for sponsors seeking website traffic or customer conversions. When clubs post sponsor spotlights with website links, analytics reveal whether followers actually visit sponsor pages. A post driving 60 website clicks delivers concrete business value beyond brand awareness.
Demographic Audience Match
Demographic data helps sponsors understand audience composition. A local sports injury clinic sponsoring an under-16s team wants confirmation that their branding reaches parents aged 35-50 within a 10-mile radius - the demographic most likely to need physiotherapy services. Analytics proving this audience match strengthens sponsor relationships by demonstrating strategic fit.
Story tagging analytics show when sponsors reshare club content to their own followers. This mutual amplification expands reach for both parties. Analytics tracking story mentions and reshares quantify this added value, potentially justifying premium sponsorship tiers for businesses that actively amplify club content.
Identifying Content That Drives Player Recruitment
Growing squads requires reaching potential players and their families beyond existing club networks. Analytics identify which content types attract new followers who might convert into registrations.
Discovery and Growth Metrics
Follower source data reveals how new accounts discover the club. Instagram analytics distinguish between followers from hashtag searches, location tags, profile visits from tagged posts, and shares from existing followers. If 60% of new followers discover the club through location tags on match day posts, this validates geotagging every fixture at the home ground.
Hashtag performance metrics show which tags drive discovery. Grassroots football clubs often use generic tags like #youthfootball, but analytics might reveal hyper-local tags like #EnfieldGrassrootsFootball or #HertfordshireU12s generate more qualified followers - local families actually seeking teams rather than casual football fans.
Save rates indicate content value. When parents save posts about trial session dates, training schedules, or club contact information, analytics signal genuine interest beyond passive scrolling. High save rates on recruitment posts suggest strong conversion potential - these engaged users are actively considering joining.
Conversion Tracking
Profile visit metrics show when content drives deeper investigation. A post about successful player development pathways that generates 40 profile visits indicates families researching whether the club suits their child. Tracking which posts drive profile visits reveals what messaging resonates with prospective members.
Website click analytics matter most for conversion. If the club includes registration links in posts, click-through data reveals whether content successfully drives families toward sign-up pages. Low click rates despite high engagement suggest adding clearer calls-to-action or simplifying registration processes.
Tracking Match Day Content Performance
Match day posts represent the highest-volume content for most grassroots clubs. Analytics reveal which approaches maximise engagement whilst minimising volunteer workload.
Format and Timing Analysis
Video versus photo performance varies significantly by platform and audience. Instagram Reels might generate 300% more reach than static photo carousels, whilst Facebook albums allow parents to browse and tag multiple images. Analytics comparing average engagement rates across content formats guide resource allocation - if videos consistently outperform photos, clubs should prioritise short video clips over extensive photo galleries.
Goal clip engagement provides clear feedback on highlight preferences. If clips of goals score 200 likes whilst defensive clearances average 40, audiences clearly prefer attacking moments. Clubs can focus editing time on offensive highlights whilst deprioritising defensive sequences.
Action shot timing matters. Analytics comparing engagement on posts published immediately after matches versus next-day recaps reveal audience preferences. Some clubs find instant post-match content capitalises on emotional momentum, whilst others discover that considered next-day posts with proper captions and editing achieve better reach.
Player Tagging and Carousel Strategy
Player tagging strategy impacts engagement. Posts tagging every squad member might generate 15 likes per tagged player as families engage with content featuring their child. Analytics quantifying this multiplier effect validate comprehensive tagging despite additional effort required.
Carousel post completion rates show whether audiences swipe through multiple images. If analytics reveal 80% of viewers only see the first photo in ten-image carousels, clubs should either reduce album sizes or ensure the strongest image leads.
Analysing Training Content Strategy
Training session content builds community and showcases coaching quality, but requires significant volunteer time to capture, edit, and post. Football social media analytics determine whether this investment delivers returns.
Training Content ROI
Training drill videos serve dual purposes - entertaining existing followers whilst demonstrating coaching standards to prospective families. Analytics distinguishing between engagement from existing followers versus new profile visits reveal whether content attracts external interest or merely entertains the existing community.
Coach spotlight posts humanise club leadership and build trust with parents. Engagement metrics on posts featuring coaches discussing player development philosophies or qualifications indicate whether audiences value this behind-the-scenes content. High engagement validates regular coach features, whilst low interaction suggests redirecting effort elsewhere.
Skill development content showing individual player progression demonstrates coaching effectiveness. Analytics tracking saves and shares on these posts indicate parents value evidence of their child's improvement - content worth prioritising despite editing time required.
Training attendance confirmation posts using Instagram story polls generate both engagement data and practical logistics information. High response rates prove this format effectively reaches parents, whilst low participation suggests reverting to dedicated team management platforms for attendance tracking.
Optimising Posting Schedule Through Data
Timing dramatically impacts social media performance, yet most grassroots clubs post whenever volunteers find spare moments. Analytics enable strategic scheduling that maximises reach without increasing workload.
Strategic Timing Windows
Platform-specific insights tools reveal when followers are most active. Facebook Page Insights and Instagram Professional Dashboard both provide hour-by-hour activity graphs. Clubs should schedule important announcements during peak windows - typically weekday lunchtimes and early evenings when parents check phones.
Day-of-week analysis identifies patterns. Analytics might reveal Saturday morning posts achieve 40% higher engagement than Sunday equivalents, as parents actively seek match day information. Conversely, Wednesday evening training recaps might underperform because families focus on midweek routines rather than scrolling social feeds.
Seasonal and Fixture Patterns
Seasonal patterns affect engagement. Analytics comparing summer holiday periods versus term time reveal whether content strategies need adjustment. Many clubs find engagement drops 30% during school holidays as families disconnect from routine football schedules, suggesting reduced posting frequency during these periods prevents wasted effort.
Fixture-related posting windows require precision. Analytics comparing posts made 48 hours before matches versus 12 hours before reveal optimal reminder timing. Too early and parents haven't confirmed weekend plans; too late and they've made alternative arrangements.
Consistency metrics matter. Clubs posting daily might assume frequency drives engagement, whilst analytics could reveal three high-quality weekly posts outperform seven rushed updates. Data-driven posting schedules respect volunteer capacity whilst optimising results.
Competitive Analysis and Benchmarking
Understanding how the club's social media performance compares to similar organisations provides context for interpreting analytics.
Contextual Performance
Local league comparisons help establish realistic benchmarks. A club achieving 4% engagement rates might seem disappointed until discovering the league average sits at 2.8%. Contextual data prevents both complacency and unrealistic expectations.
Follower-to-engagement ratios matter more than absolute numbers. A club with 300 followers generating 60 average likes per post (20% engagement) outperforms a team with 1,200 followers averaging 80 likes (6.6% engagement). Analytics focusing on engagement rates rather than vanity metrics provides an accurate performance assessment.
Successful content analysis from similar clubs provides inspiration. When local rivals achieve exceptional engagement on specific content types, analytics reveal what works. A neighbouring club's training drill videos consistently generate 150+ likes, suggesting this format resonates with grassroots football audiences.
Hashtag research identifies trending topics within grassroots football communities. Analytics tools tracking hashtag performance reveal which tags currently drive discovery, allowing clubs to ride momentum from broader conversations around youth development, coaching initiatives, or Sunday league football.
Converting Analytics into Actionable Strategy
Data only delivers value when translated into concrete actions that improve club communication and community building.
Implementation Process
Monthly analytics reviews should become standard practice. Volunteer managers dedicating 30 minutes monthly to review performance metrics can identify trends impossible to spot through daily observation. Consistent reviews reveal whether strategic changes actually improve results or need further adjustment.
A/B testing different approaches provides definitive answers. Post the same match recap twice - once as a photo carousel, once as a video reel - and compare engagement metrics. Data eliminates guesswork about which formats resonate with specific audiences.
Content calendars informed by analytics prevent reactive posting. Understanding that fixture announcements posted on Tuesday lunchtimes achieve optimal reach allows scheduling these posts in advance, reducing last-minute volunteer stress whilst improving performance.
Audience surveys complement quantitative analytics with qualitative insights. Instagram story question stickers asking "What content do you most value?" generate direct feedback that explains why certain metrics perform well, whilst others underperform.
Documentation creates institutional knowledge. When volunteer managers transition between seasons, recorded analytics insights prevent new teams from repeating failed experiments. A simple spreadsheet tracking monthly engagement rates, top-performing posts, and strategic learnings preserves valuable knowledge.
Conclusion
Football social media analytics transform grassroots club communication from hopeful broadcasting into strategic engagement. Rather than posting blindly and hoping parents see fixture updates or sponsors receive visibility, data-driven approaches ensure every post serves specific purposes and reaches intended audiences.
For time-poor volunteer managers, analytics prevent wasted effort by identifying what genuinely works. Understanding that Instagram stories achieve 90% reach amongst squad parents, whilst Twitter posts reach 15% allows clubs to focus limited volunteer hours on effective channels. Similarly, discovering that video content generates triple the engagement of static photos justifies investing time in simple smartphone clips rather than extensive photo galleries.
The clubs succeeding in digital engagement don't necessarily post most frequently or maintain a presence on every platform. They post strategically, using analytics to understand their specific audience's preferences, optimal timing, and content priorities. This evidence-based approach respects volunteer capacity whilst strengthening community connections, sponsor relationships, and player recruitment.
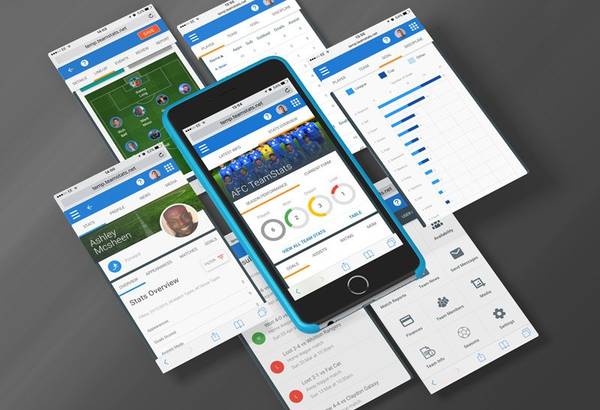
Modern team management extends beyond pitch-side coaching into digital community building. Analytics provide the roadmap, showing which paths lead toward stronger engagement and which waste precious volunteer time. TeamStats helps grassroots football clubs embrace this data-driven mindset through integrated analytics features that make tracking and interpreting performance metrics straightforward for volunteers without technical backgrounds. Clubs don't just improve social media metrics - they build more connected, sustainable communities around the teams they serve. For volunteer managers ready to transform their digital engagement strategy, a team management app provides the tools to track what matters and act on insights that strengthen club communities.
═══════════════════════════════════════════════════════════════