Did you know that data providers now collect hundreds of metrics per football match, thanks to advancements in tracking software and AI?
The final score tells only part of the story. A single win or loss can mislead viewers since it might result from a lucky bounce, a moment of individual brilliance, or a contentious refereeing decision. This reality makes us look deeper into football statistics to truly understand what happened on the pitch.
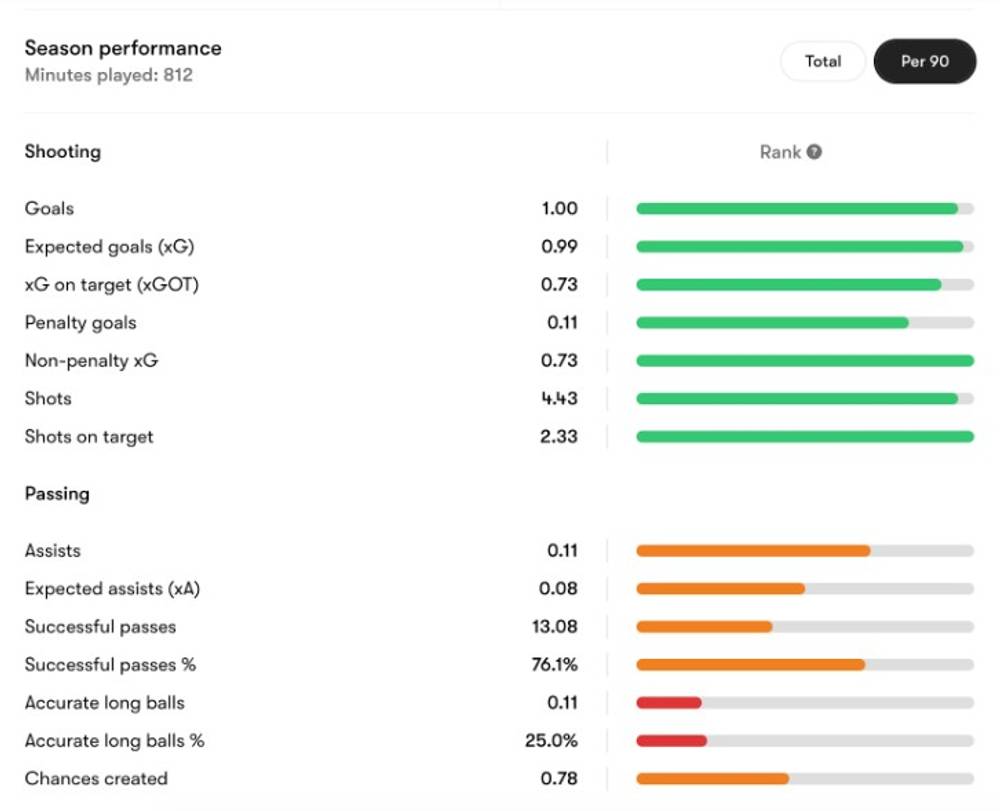
Football player statistics have transformed through metrics like Expected Goals (xG), which now shape how we review performance. xG measures the quality of a chance by calculating the likelihood that it will be scored, using information on similar shots from the past. To cite an instance, see how top striker Robert Lewandowski averages an incredible 0.99 xG per 90 minutes played - a level described as "break the game" obscenely high.
This piece guides you through simple football statistics to advanced metrics used by professionals. You'll find everything from the best football statistics websites to football statistics databases that help you understand matches better.
The knowledge you gain will help you analyse football statistics like a pro. You can track football streaks statistics or delve into the football statistics Premier League managers use daily.
Understanding the Basics of Football Stats
Football statistics have grown from simple goal tallies into detailed data systems that track every move on the field. Simple metrics are the foundations of match analysis and include possession percentages, shots on target, and passing accuracy. These core numbers reveal how teams dominate and perform during games.
A team's ball possession shows their control over the match, but context matters more than raw percentages. The location of possession proves more valuable than time stats. Shot accuracy demonstrates attacking prowess, while passing success shows how well teams maintain control.
Technology has revolutionised data collection methods since the 1990s. Modern statistical systems combine multiple approaches:
-
Optical tracking systems installed in stadiums
-
GPS data from player wearables
-
Manual input by trained analysts
These systems deliver live data with error margins under 5%, though human judgement still determines subjective stats. Opta's story illustrates this development - the company started analysing Premier League matches in 1996 and became its official stats provider just a year later.
Modern football databases help teams spot trends, tactics, and patterns. These insights guide future decisions with statistical evidence, which makes them valuable tools for coaches, fans, and analysts.
Advanced Metrics That Reveal More
Simple statistics only tell part of the story in football performance analysis. Expected Goals (xG) has revolutionised the game by giving each shot a probability value based on distance, angle, and assist type. A tap-in from close range could have an xG of 0.8 (80% scoring chance), while a shot from far out might only get 0.1 (10% chance).
Expected Assists (xA) works in a similar way but focuses on pass quality instead of just counting assists. This metric shows how likely a pass will lead to a goal, whatever the teammate does with the ball.
The effectiveness of pressing can be measured through Passes Allowed Per Defensive Action (PPDA), where lower numbers show more aggressive pressing. Manchester City topped the Premier League with a 32% pressure success rate and won back possession within five seconds of applying pressure.
Expected Offensive Value Added (xOVA) takes both open-play xG and xA into account and subtracts xA received to show a player's individual offensive contribution. Expected Threat (xT) helps us learn about how passes and carries help create scoring chances.
Platforms like Hudl Statsbomb now give analysts access to more than 160 metrics, including xG, player heatmaps, and passing patterns. These tools help teams quickly spot unique performance patterns and make informed decisions.
Analysing Like a Pro: Tools, Context, and Application
Technology has revolutionised football analysis far beyond simple numbers. Analysts now use sophisticated video tools to examine plays frame by frame. This capability lets coaches study player movements, tactics, and specific game situations with unprecedented detail.
Teams rely on professional platforms like Catapult Pro Video to capture footage from multiple angles. The system connects performance data to video and lets teams share findings instantly. Both post-match analysis and pre-match preparation depend heavily on these systems. They help teams spot opponent weaknesses and fine-tune their tactical approaches.
GPS tracking systems like Vector Pro and Vector Core measure player movements with remarkable precision. These devices track detailed metrics such as high-speed running and sprint efforts. They also provide live data during matches.
Statistical interpretation in football needs significant context. Teams must analyse numbers while considering opposition quality, game conditions, and tactical setup. A player's high pass accuracy might not tell the whole story if most passes go backwards or sideways.
Professional analysis requires several key approaches:
-
Creating percentile ranks helps understand relative performance across leagues
-
Developing visualisations like passing networks and heat maps shows patterns clearly
-
Using event data reveals tactical patterns and team dominance across pitch zones
The end goal turns raw numbers into practical information that enhances on-field performance.
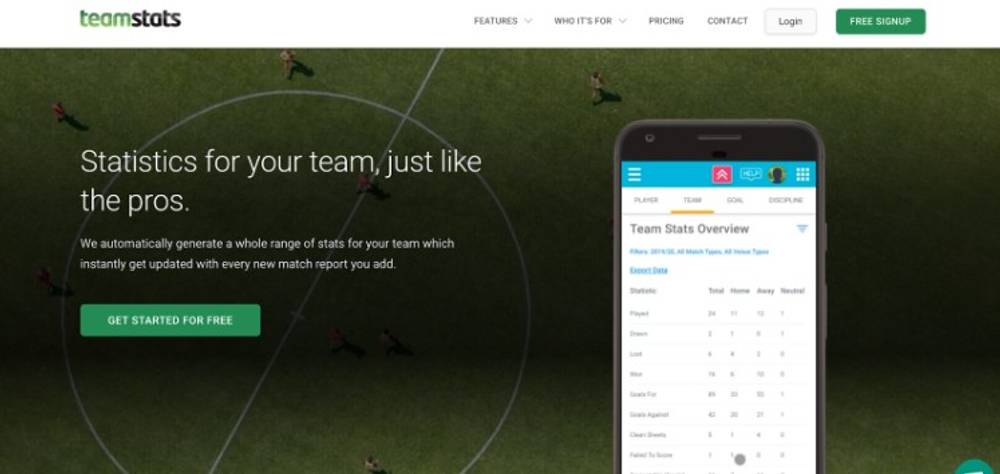
If you want a clean “numbers + narrative” workflow, TeamStats is useful for local teams and smaller leagues because it lets coaches generate structured match reports (line-ups, goals, assists, key moments) that you can reference when you’re checking form and patterns, not just final scores. For example, their match-report format helps you log what actually happened in a game so you can sanity-check takes like “they dominated” or “they were lucky” against a consistent recap.
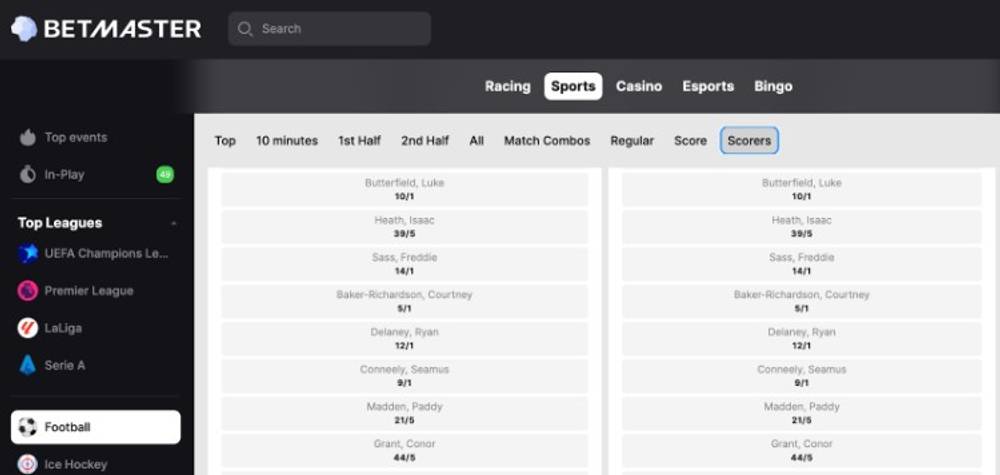
Once you’ve got that match context written down, you can move to the pricing side by comparing it against the market on a sportsbook like Betmaster UK, which covers football markets plus live betting, and regularly promotes welcome bonuses such as matched deposits for new accounts. Used together, the idea is simple: TeamStats helps you organise the “what happened and why” notes, then a sportsbook helps you see whether the odds you’re being offered match the story your data is telling you.
Key Takeaways
Football statistics have evolved beyond simple goal and shot counting. This piece explores data analysis's journey from match statistics to sophisticated metrics that tell the true story behind each match. Players and fans now have tools that give unprecedented insights into performance, tactics, and outcomes.
Simple statistics remain valuable but show only one side of the story. Advanced metrics like Expected Goals (xG) and Expected Assists (xA) add remarkable depth to our understanding of the beautiful game. These measurements help analysts look past the final score to assess what happened on the pitch.
Context plays a vital role when analysing football statistics. Teams might control possession without creating quality chances. Players could post impressive passing numbers with minimal effect on attack. The best analysts blend statistical knowledge with tactical understanding to reach meaningful conclusions.
Technology is rapidly advancing football analytics. More sophisticated metrics and analysis tools will emerge soon. GPS tracking, AI-powered video analysis, and up-to-the-minute performance data have changed how professionals approach the game.
Statistics offer a powerful lens to view the game - whether you're a coach planning strategy, a fan debating with friends, or someone wanting to understand football better. Numbers don't tell the complete story, but they definitely help us ask better questions and challenge our assumptions.
Understanding both simple and advanced football statistics leads to deeper appreciation of pitch events and match results. Next time you watch a match, look beyond the score – the data often reveals the true story.