Not long ago the gulf between a fan and a TV analyst felt wide and obvious: one side shouted from the terraces, the other spoke with charts and insider context. That divide is shrinking. Smartphones, advanced stat providers, and accessible visualizations have handed many analytical tools once reserved for pros to ordinary viewers. You don’t need a newsroom login anymore to see expected goals, player heat maps, or tracking overlays. The game is quieter in some ways, louder in others — because now everyone can argue with the same numbers.
Tools that changed the conversation
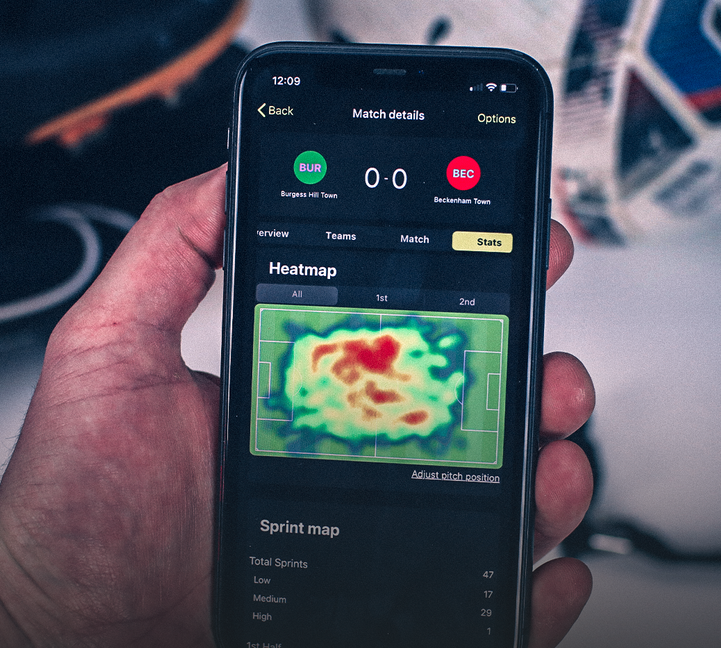
Wearables, optical tracking, and event data feed a steady stream of objective measures. Companies like Opta, StatsBomb, and Sportradar collect millions of touch-by-touch entries and position points. Broadcasters and apps weave those feeds into graphics and alerts so a casual fan can follow a player’s pressing intensity or sprint profile as easily as checking the score. Real-time statistics and data-driven sports betting insights now allow fans to engage with games on a more analytical level, turning halftime chats into mini tactical briefings.
But it’s not only pro-level feeds. Free and low-cost apps democratize advanced metrics, and social platforms amplify them. A viral tweet will explain a manager’s substitution with a three-panel graphic; a short video will show a player’s passing lane trends across the season. Fans learn, adapt, and — crucially — start asking the same incisive questions analysts always did.
How this changes fandom
There’s a practical upside: better debate. Fans can back opinions with numbers instead of vibes. It’s easier to spot undervalued players, identify tactical weakness, or call out misleading narratives. Clubs respond too. Teams use the same data to shape content, offering fans behind-the-scenes metrics and custom visual explainers. Engagement deepens when supporters feel they understand the chessboard, not just the checkmate.
Still, the new normal has texture. For some, numbers add delight — the “aha” of seeing a pattern you missed live. For others, it introduces a coldness, a constant tilt toward measurability. Who hasn’t felt that small disappointment when a miraculous goal becomes, in the next graphic, “a $0.03\ xG$ event”?
Where the line blurs between pros and amateurs
Analytics platforms have matured: interactive dashboards, simple play-replays with overlaid expected assists, and player comparison tools make analysis teachable. Podcasts and newsletters translate the jargon without dumbing it down. Amateur analysts — students, bloggers, superfans — publish work that rivals traditional outlets. The barrier is lower, and curiosity drives learning. It used to be specialist; now it's communal.
There are limits, of course. Data quality, sample size, and context matter. Numbers can mislead if they’re decontextualized. The best fan-analysts are those who mix stat literacy with the messy human eye.
Final thoughts
This is not purely technical progress. It’s cultural. Fans today can choose to watch with wonder or with a spreadsheet — or both. That choice is liberating and uncomfortable. When every decision is based on data, some argue that the emotional connection between players and fans may weaken. That’s worth wrestling with. But for many, having access to the tools of analysis has simply made rooting feel smarter, not colder.
What do you think? Did the numbers make your love of the game deeper or more complicated? Leave a comment below and share the stat, tweet, or moment that changed how you watch.