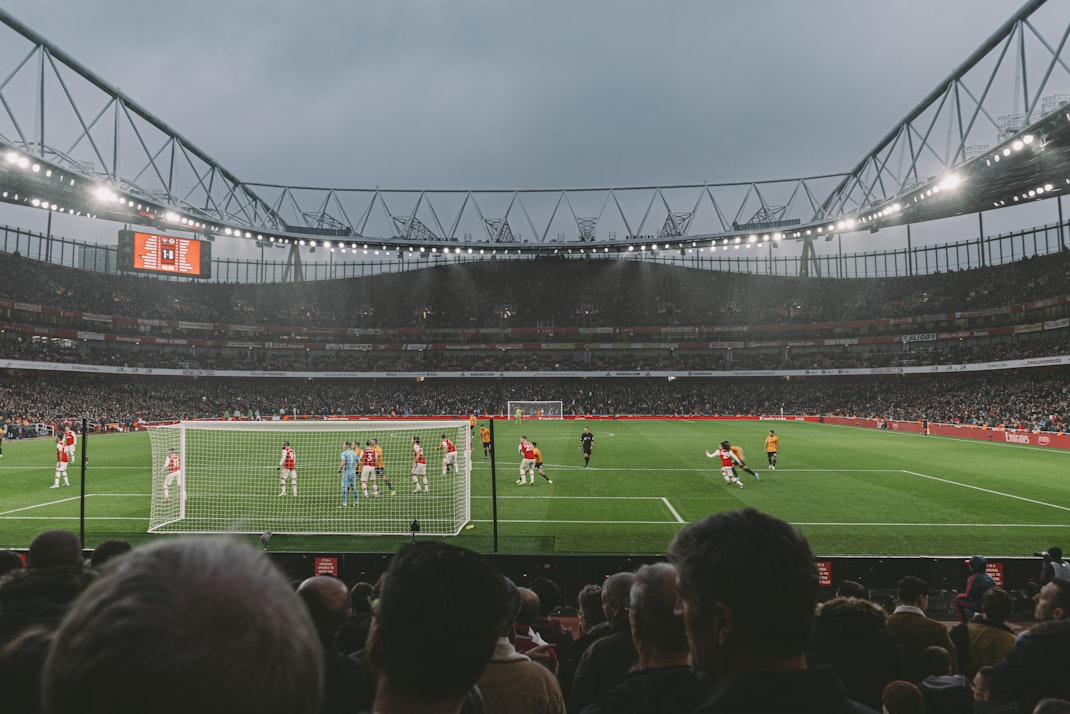
In professional football, data no longer sits in the background. It defines how clubs prepare and how bettors interpret matches. Heat maps, once limited to training sessions, now reveal where control fades or pressure builds. They visualise how teams move, where they lose shape, and which zones remain unguarded.
During live broadcasts, these coloured grids tell stories numbers alone cannot. Watch football live and bet now involves understanding such tactical graphics rather than reacting to scorelines. Observers read them like weather patterns - areas glowing red show intensity, blue marks hesitation. What happens between those shades determines where goals emerge or vanish.
The modern bettor values what the eye misses. Heat maps uncover rhythm, imbalance, and defensive fatigue. When analysed across several games, they expose habits that affect both possession and scoring trends.
Identifying Patterns Behind the Image
Heat maps work by tracking player positions and ball touches. When compared across teams, they highlight where formations collapse or flourish. Analysts often measure dominance through touches in the final third, but defensive gaps tell an equal story.
A few details often define meaningful heat map trends:
-
Consistent gaps between midfield and defence lines
-
Overloaded flanks where full-backs drift forward too early
-
Unused central zones during transition phases
-
Sudden cold zones showing lack of passing options
Each signal helps bettors and analysts estimate how match control changes over time. Teams with too many red zones in their half often concede through fatigue rather than tactical fault.
From Data to Field Insight
Clubs now combine real-time GPS tracking with thermal maps to refine strategy. Analysts adjust formations based on the density of movements. A midfield shaded orange for most of the match suggests limited recovery. That often correlates with late-match goals conceded.
Within betting logic, these visual cues hold significant value. The shift from intuition to pattern recognition changed how results are predicted. In many competitive leagues, matches with similar possession but different heat density produce opposite outcomes. What looks balanced statistically may in fact hide control imbalance.
Translating Heat into Betting Context
For bettors, the challenge lies in knowing when pressure turns into efficiency. A bright red half does not always indicate control. Sometimes, it means panic passing under high press. Recognising that difference requires experience and careful review of match patterns.
The line where sports insight meets betting tactics now defines modern prediction. Bettors who study pre-match heat maps can forecast vulnerabilities like tired flanks or exposed midfield gaps. Many professional analysts cross-check those visuals with team rotations and fixture congestion before forming conclusions.
Platforms increasingly visualise these maps interactively, allowing comparison between home and away performances. When a team shows reduced attacking heat in away fixtures, it usually reflects deeper tactical caution rather than loss of form.
Interpreting Data without Overreliance
Raw graphics can mislead when isolated from context. Weather, pitch size, and opponent structure distort readings. To make heat maps meaningful, analysts align them with complementary statistics such as passes per zone or pressure regains.
The 1xbet company includes such multi-layered analyses in coverage of high-profile matches. For bettors, this level of breakdown transforms guessing into measured assessment. It reflects how data science and field behaviour converge inside a 90-minute contest.
By registering on the official 1xbet website, players have the opportunity to increase the maximum bonus on their first deposit thanks to the promo code: 1x_3831408. (The terms and conditions for receiving the bonus amount vary depending on the country from which the registration is made.)
Practical Application in Market Reading
Heat maps now guide traders setting totals or possession markets. Teams displaying high density in wide zones usually produce more crossing opportunities, affecting corner and shot odds. Conversely, central congestion reduces tempo and limits goal volume.
Common betting observations from heat map analysis include:
-
High flank activity suggests potential for early corners
-
Cold attacking thirds signal under goals markets
-
Central overheating may mean open midfield transitions
-
Compact defensive zones predict reduced scoring volume
Such findings explain why analysts treat heat maps as narrative tools rather than numbers. They describe flow, intention, and fatigue in colour.
Integrating Vision and Logic
In modern football analysis, graphics speak as loudly as commentary. Reading heat maps demands the same discipline as tactical study - observation over assumption. Many bettors using top analytical platforms like 1xbet - best betting site combine visual readings with statistical tables for accuracy.
While technology continues to evolve, interpretation remains human. Behind every glowing red patch stands a player caught between instruction and instinct. Understanding that tension defines why heat maps matter - they turn football’s chaos into patterns that, when read carefully, reveal where the game tilts before the whistle blows.